// server-rendered graphics
Demos
Each plot is generated on the server in Go and streamed back as a GIF or SVG. Open one to see its parameters and run it live.
 /lis
/lis
Lissajous
ch.1 · GIF
Animated Lissajous curves.
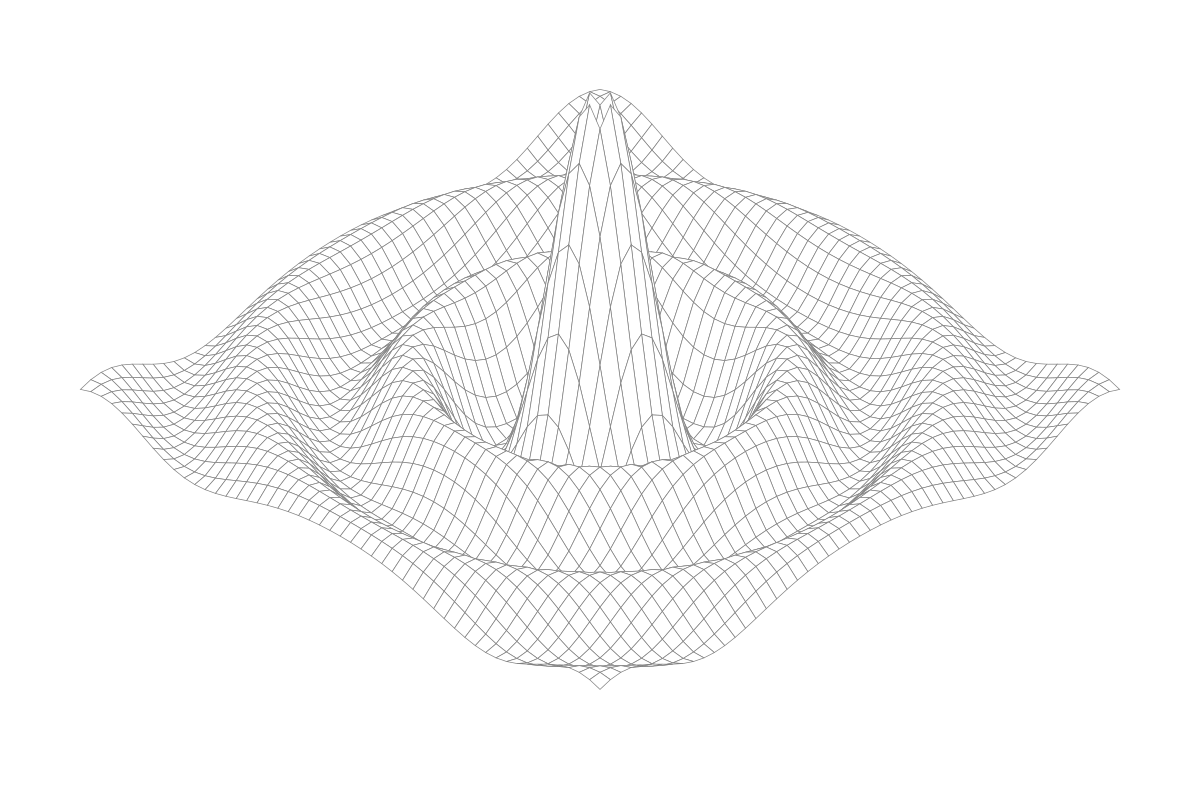 /sinc
/sinc
Sinc
ch.3 · SVG
3-D sinc surface, scalable SVG.
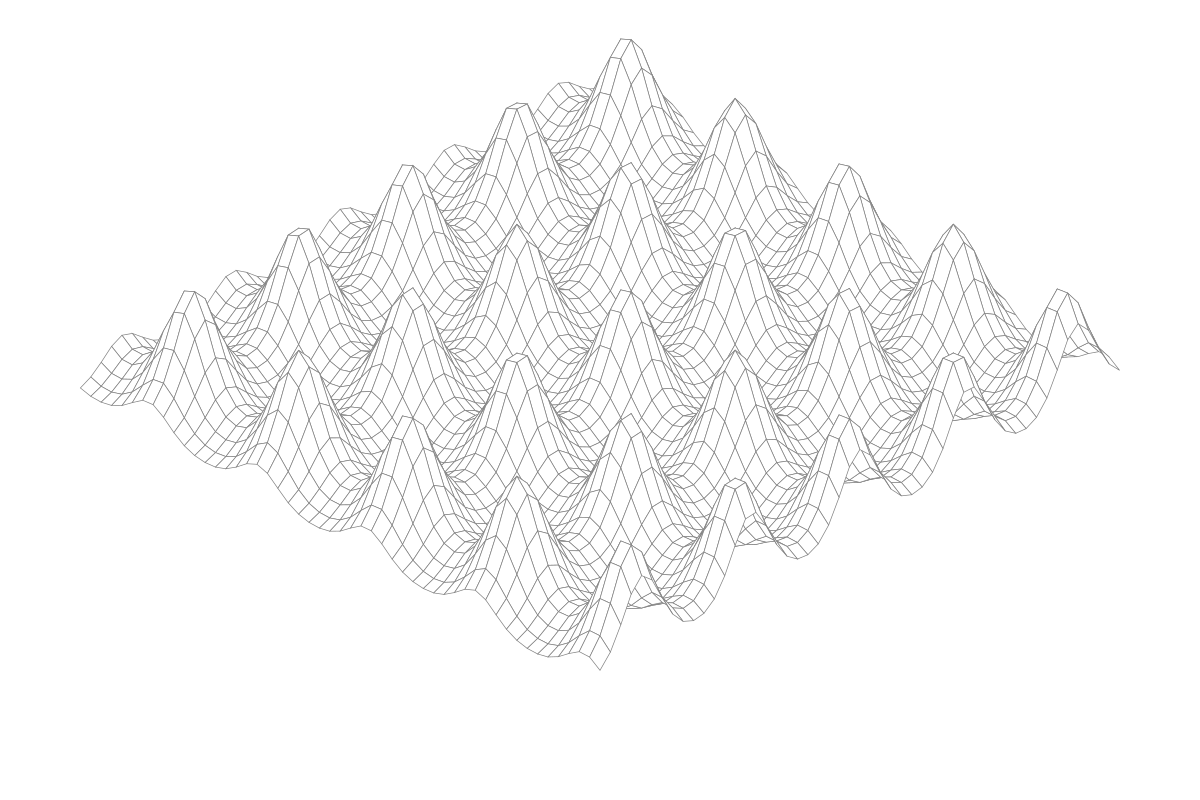 /egg
/egg
Egg
ch.3 · SVG
Parametric egg surface.
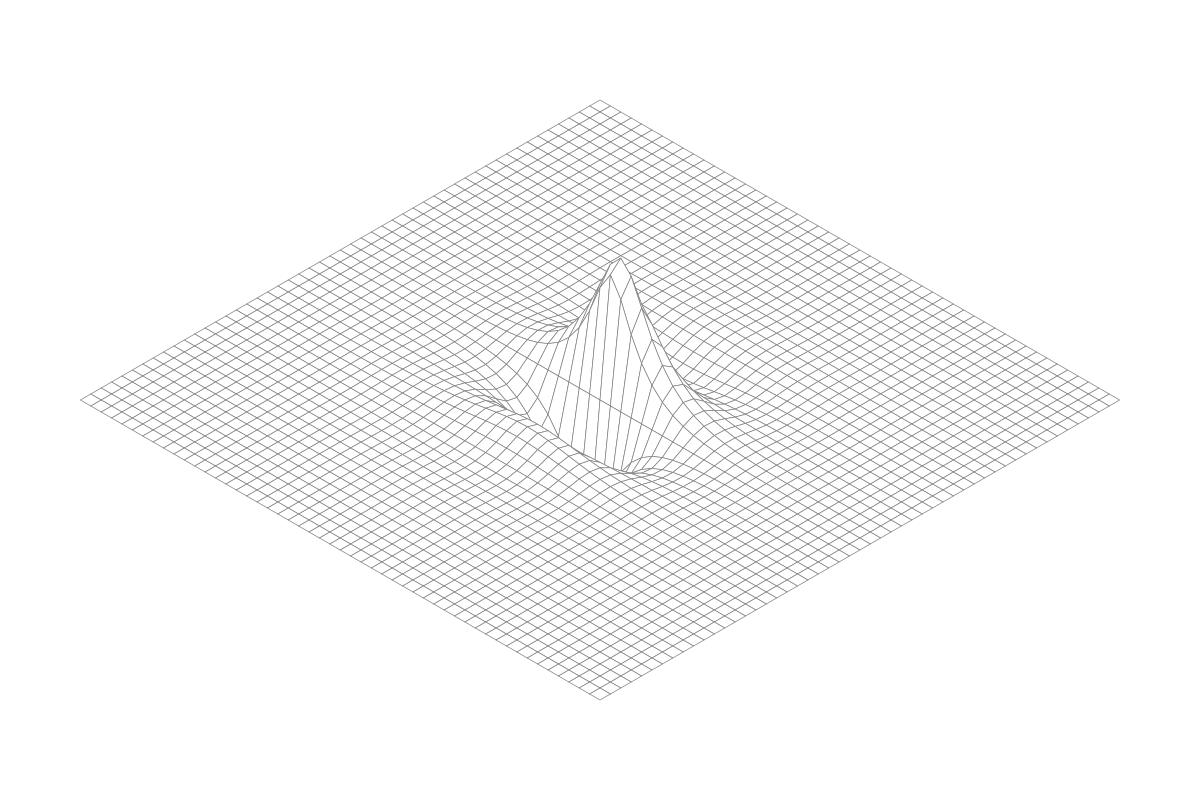 /valley
Valley
ch.3 · SVG
Saddle / valley surface plot.
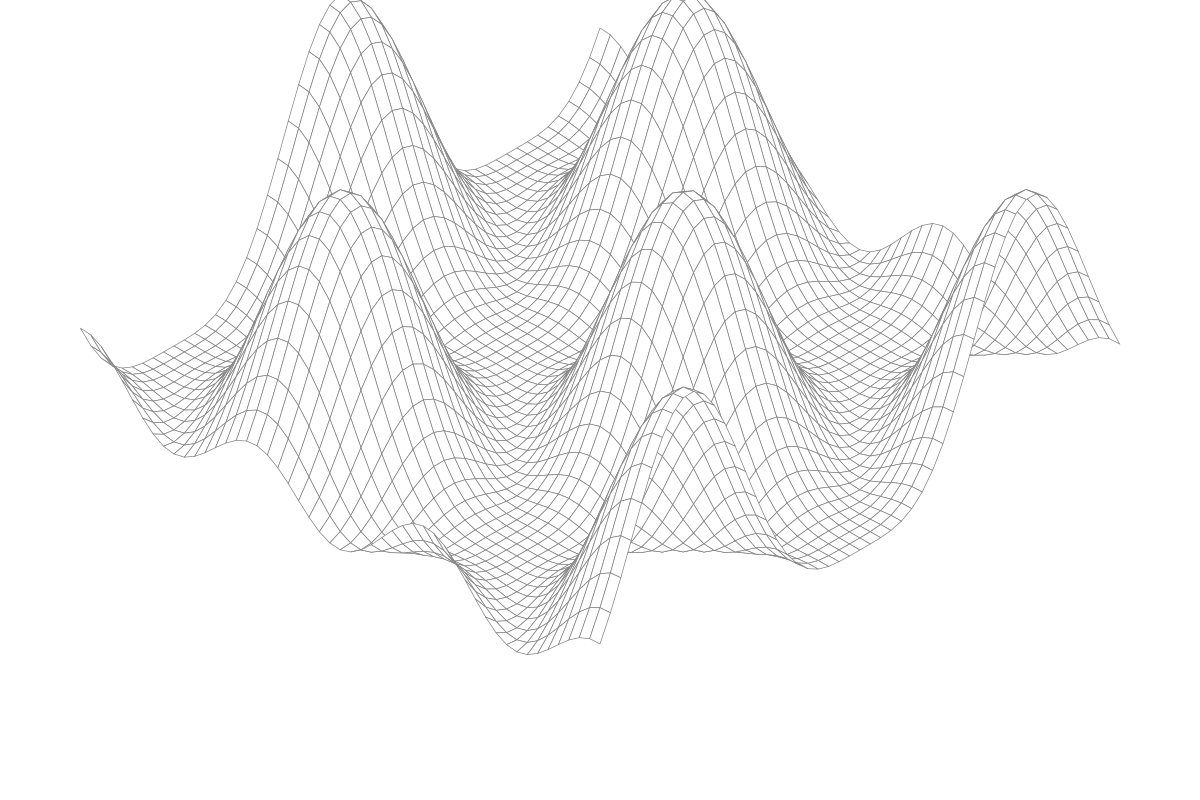 /sq
/sq
Squares
ch.3 · SVG
Tiled squares surface.
/post
Post Data
tool · echo
Send fields and inspect the exact request the server receives.